Image 1 of 1: ‘Screenshot showing the RStudio interface with three main panes: the console on the left, the environment/history/connections tab in the top-right pane, and the plots/packages/help tab in the bottom-right pane. Menus and toolbars are located at the top.’
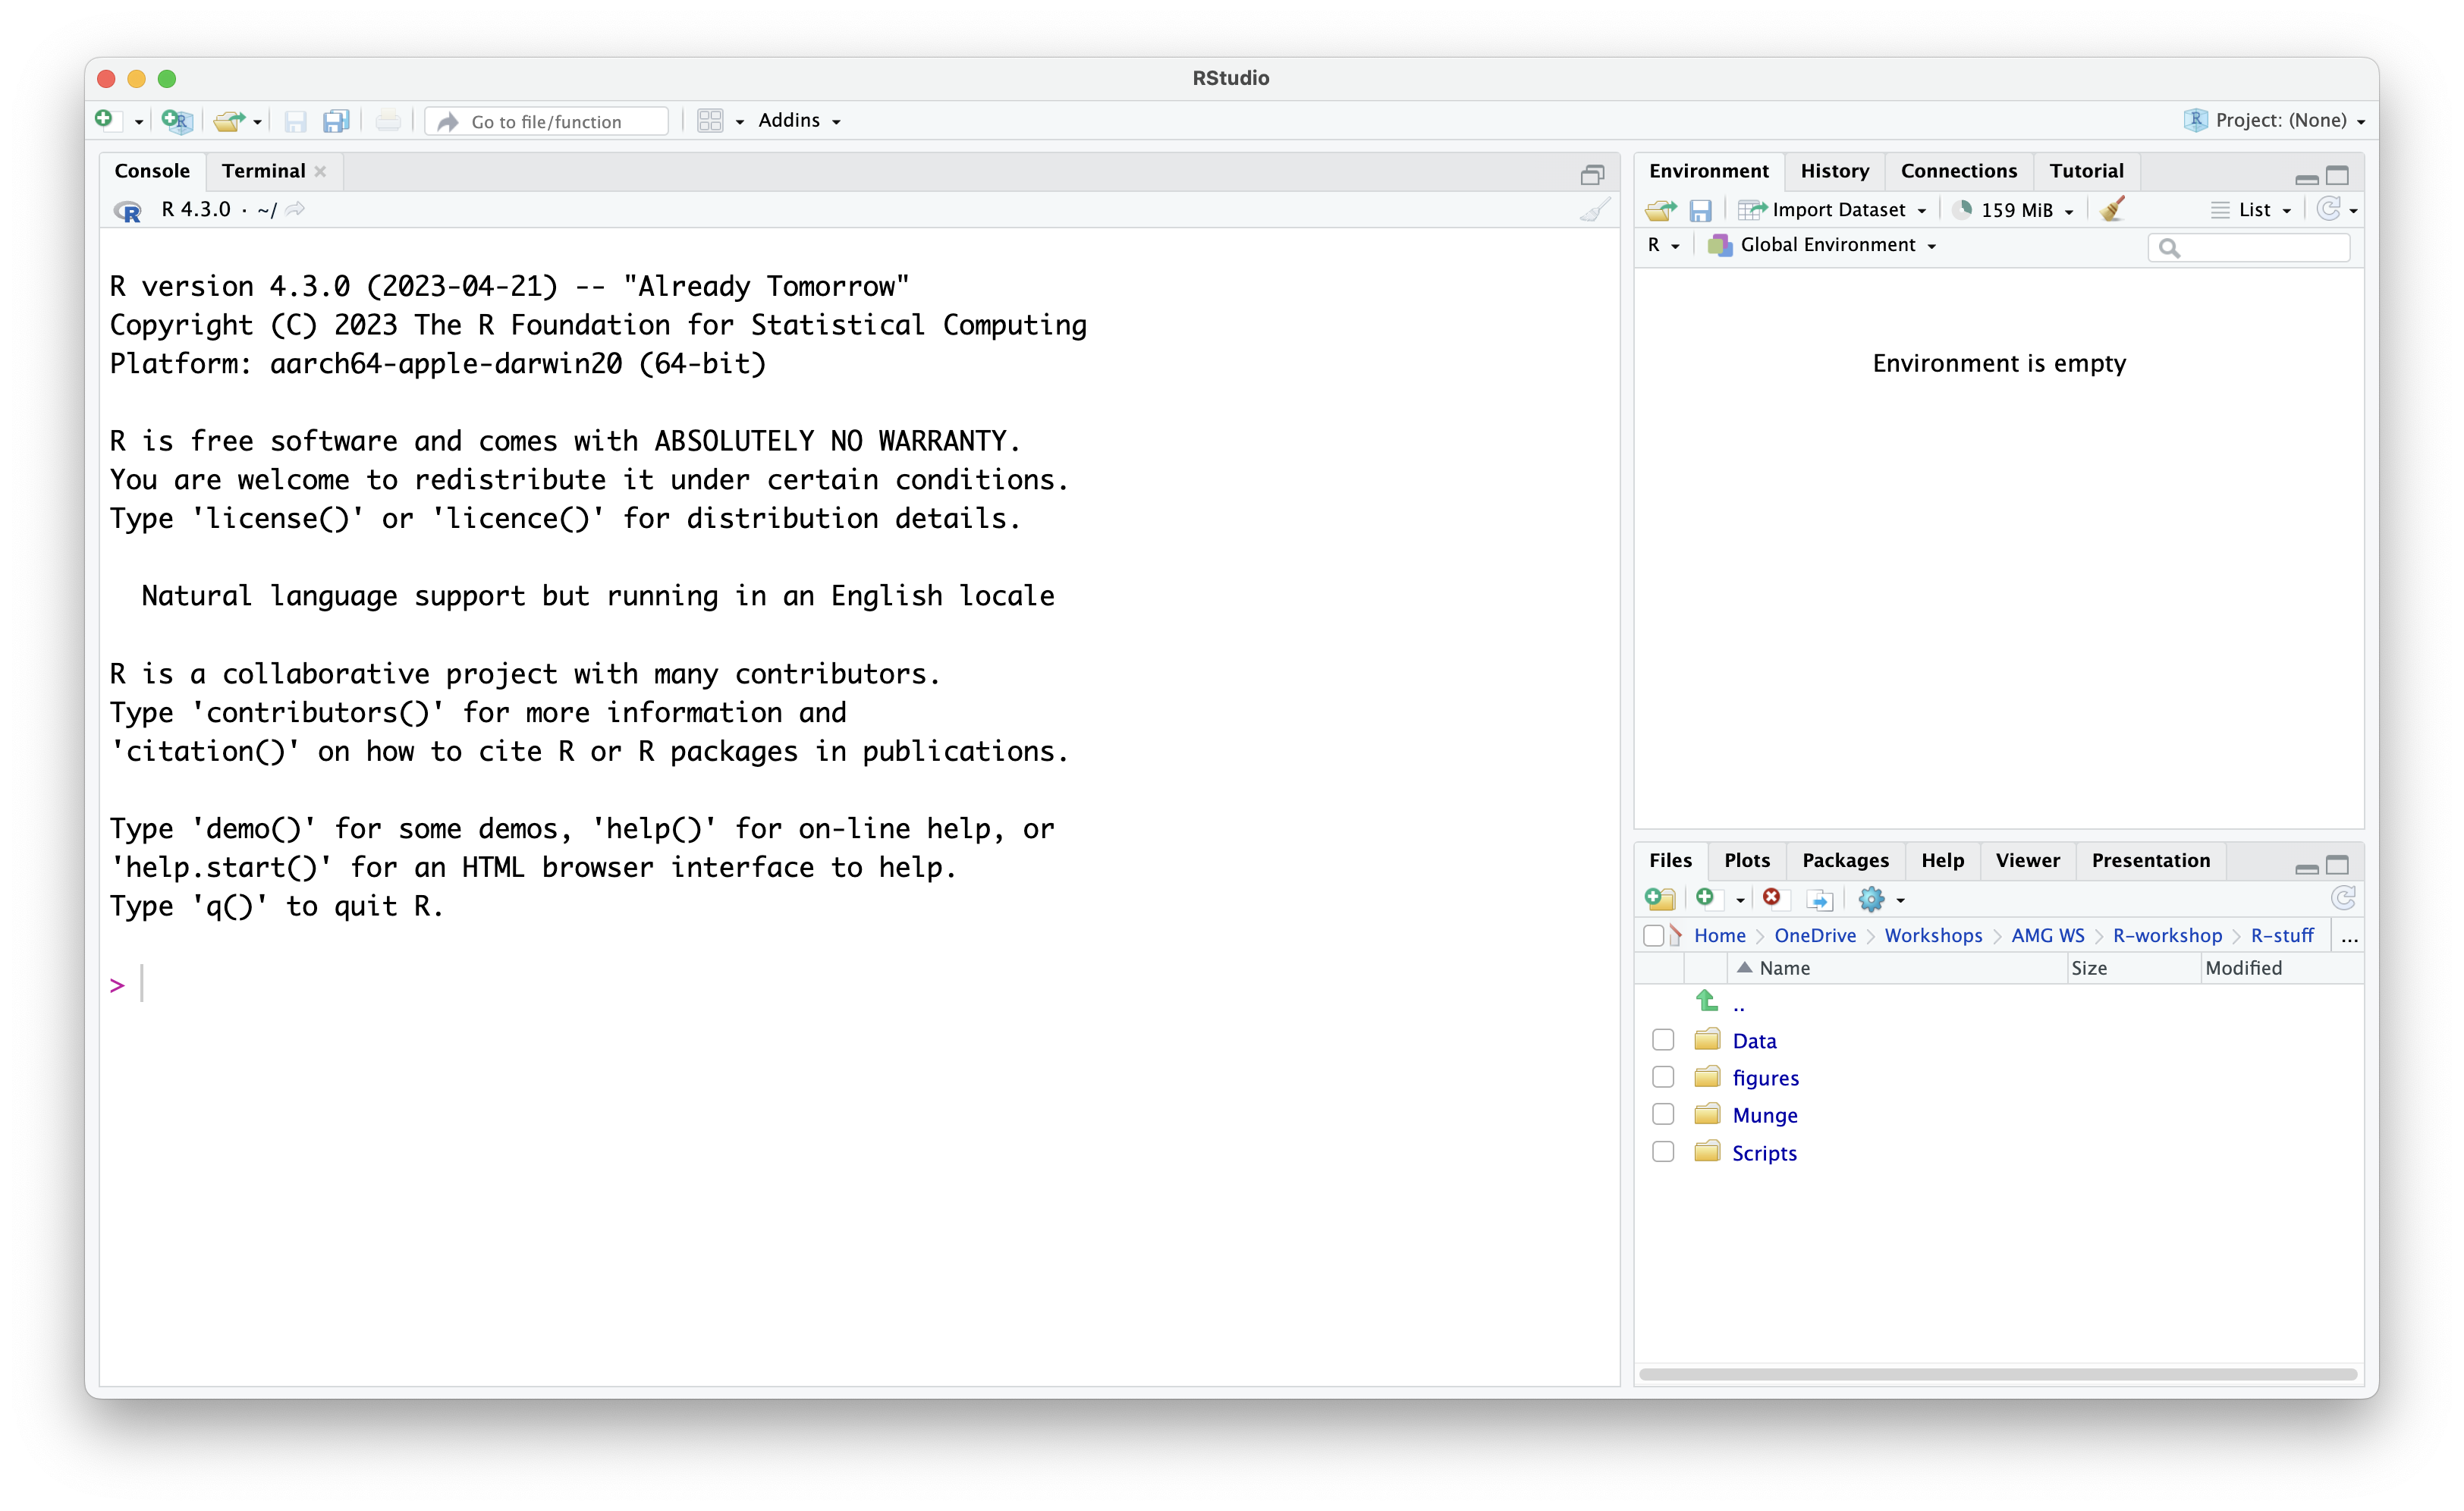
The default layout in RStudio
Figure 2
Image 1 of 1: ‘Screenshot showing the RStudio interface with four main panes: the script editor in the top-left pane, the console in the bottom-left pane, the environment/history/connections tab in the top-right pane, and the plots/packages/help tab in the bottom-right pane. Menus and toolbars are located at the top.’
The RStudio layout now including the R script
editor